Geovpf is an additional library that is used to render Vector Product Fromat including Digitial Nautical Charts.
This library is designed to work with versions of GTK older than 2.8. Projects that have the ability to use newer versions of GTK should use the newer geoc. The geoc library has many API simplifications that are not available in this older library.
Geocanvas provides a set of drawing objects that are based on objects defined in the foocanvas library from Gnome CVS. The foocanvas library is included as part of this package and therefore does not need to be downloaded and compiled separately.
GeoCanvas *canvas;
GeoCanvasGroup *group;

/* The GeoCanvas will create its own projection if one is not specified.
 * Here the panning is enabled continuously via mouse the middle mouse button.
 */
canvas = GEO_CANVAS(g_object_new (GEO_TYPE_CANVAS,
        "pan_state", GEO_CONTINUOUS_ACTIVE,
        "pan_button", 2,
        NULL));

/* This example draws a rectangle centered around 41:15N, 71:15W.
 * The GeoCanvasGroup object has a common interface for drawing lines, polygons,
 * and point features.
 */
group = geo_canvas_group_new(foo_canvas_root (FOO_CANVAS(canvas)),
        GEO_TYPE_CANVAS_LINES,
        "itemtype", FOO_TYPE_CANVAS_LINE,
        "fill_color_rgba", 0xff0000ff, NULL);
geo_canvas_group_begin(group);
geo_canvas_group_add_point(group, -71.5, 41.0);
geo_canvas_group_add_point(group, -71.0, 41.0);
geo_canvas_group_add_point(group, -71.0, 40.5);
geo_canvas_group_add_point(group, -71.5, 40.5);
geo_canvas_group_end_segment(group);
geo_canvas_group_end(group);
|
import geocanvas

canvas = geocanvas.Canvas()

group = canvas.root().add(geocanvas.CanvasLines,
        itemtype = geocanvas.foocanvas.CanvasLine,
        fill_color_rgba = 0xff0000ffL)
group.begin()
group.add_point(-71.5, 41.0)
group.add_point(-71.0, 41.0)
group.add_point(-71.0, 40.5)
group.add_point(-71.5, 40.5)
group.end_segment()
group.end()
|
geovpf provides a GObject interface that is used to plot Vector Product Format (VPF) onto the geocanvas.

/* The GeovpfCanvasTheme is used to display all feature types - edge, face,
 * entity_node, connected_node, and text..
 *
 * library_path: location of the library.  Use of directory path can be avoided
 * by using the GeovpfDatabaseLookup object.
 *
 * coverage: a set of topologically related feature classes.  Earth coverage in
 *              in this case.
 *
 * feature_class: features that share a homogenous set of attributes.  Earth
 *              coverage areas in this case.
 *
 * expression: thematic information (a limited database query).
 *             This example queries for land and island coverage.
 */
foo_canvas_item_new(group, GEOVPF_TYPE_CANVAS_THEME,
        "library_path", "/home/username/dnc/dnc17/a1707420",
        "coverage", "ecr",
        "feature_class", "ecrarea",
        "expression", "F_CODE=BA030 or F_CODE=DA010",
        "fill_color_rgba", 0xBDAF1Bff,
        NULL);
|
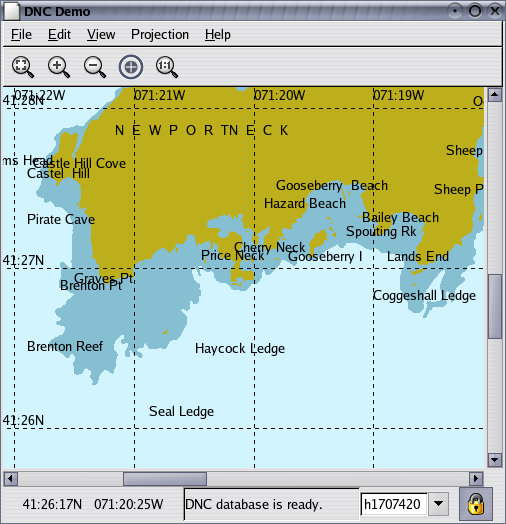
The VPF dataset shown in the screenshot is from Digital Nautical Chart (DNC) 17 available from this link.
The demo program included in the package is written specifically for DNCs. It will show a blank map unless dnc information is available at the ~/dnc directory level.